
How Many Cans Per Day Can a Fish Canning Production Line Produce
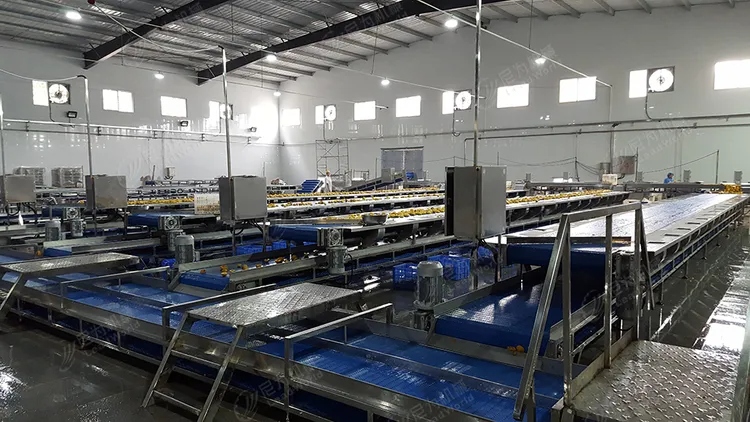
The most common sizing question for a fish canning line — "how many cans per day can it produce?" — has three different answers depending on which layer of capacity you are asking about. The filler runs at a fixed cans-per-minute rate, but that rate is interrupted every time the retort completes a batch, and the shift output is further reduced by changeover, cleaning, and unplanned stops. A line sized on nameplate CPM alone will consistently deliver 60–75% of the daily number the buyer expected. This article breaks fish canning line capacity into three layers, shows a worked reverse-sizing example from a target shift output back to the required filler, retort, and raw fish input, and provides a downloadable capacity calculator.
The scope covers weight and unit-flow capacity from the filler to the cooled, palletized can — the segment where capacity is governed by equipment speed, batch logic, and operating discipline. It does not cover mass balance (covered separately), scheduled-process design, or water and energy balance. For the full canning production line equipment map, this sizing model is the time-flow counterpart to the weight-flow mass balance.
The Three Layers of Fish Canning Line Capacity
Capacity on a fish canning line is not a single number. It is three numbers, each governed by different equipment, and each able to become the bottleneck that caps the others. Confusing the three is the root cause of most sizing mistakes.
| Layer | What it measures | Governing equipment | Typical reference range | Bottleneck signal |
|---|---|---|---|---|
| Filler CPM (instantaneous) | Cans sealed per minute when the filler-seamer is running | Filler and seamer | 50–400 CPM depending on format and automation | Filler utilization below 70% while downstream is starved |
| Retort batch capacity (batch-gated) | Cans thermally processed per retort batch, per hour | Retort count, basket capacity, cycle time | 2,000–12,000 cans per batch depending on retort size and can format | Retort starvation (filler waiting) or retort backlog (cooling overflow) |
| Shift output (OEE-reduced) | Good cans produced per shift, after all losses | Whole line, including cleaning, changeover, and stops | 60–80% of theoretical shift output in a disciplined plant | Gap between theoretical and actual shift output above 30% |
Read the table vertically and the pattern is clear: the filler sets the ceiling, the retort sets the gate, and the operating discipline sets the floor. A line is correctly sized only when all three layers are balanced — a fast filler starved by a slow retort produces the same shift output as a slower filler, at higher capital cost.
Cans per Minute: The Filler Is the Pace-Setter
The filler-seamer is the only piece of equipment on a fish canning line that runs at a fixed mechanical cadence. Everything upstream (butchering, precooking, cleaning, portioning) feeds it, and everything downstream (retort, cooling, labeling, palletizing) absorbs its output. Sizing the filler CPM is therefore the first sizing decision, and it determines the maximum theoretical throughput of the entire line.
Two CPM numbers matter, and they are not the same:
- Nameplate CPM is the mechanical maximum the filler-seamer can sustain under ideal conditions, stated by the equipment supplier. It is the number on the datasheet and the number buyers tend to anchor on.
- Effective CPM is the average cans-per-minute the filler actually delivers over a shift, after micro-stops, fill-weight corrections, seamer adjustments, and brief product changes. Effective CPM is typically 70–85% of nameplate CPM on a well-run line, and lower on a poorly run one.
The gap between nameplate and effective CPM is not a defect — it is the reality of running a food line with biological raw material. Sizing on nameplate CPM alone produces a line that cannot meet its shift target; sizing on effective CPM produces a line that can. The reference ranges below show how CPM shifts with can format and automation level.
| Can format | Automation level | Typical nameplate CPM | Typical effective CPM |
|---|---|---|---|
| Tuna can, 170–200 g | Fully automatic, rotary filler-seamer | 250–400 | 180–320 |
| Tuna can, 170–200 g | Semi-automatic, inline filler + rotary seamer | 80–150 | 60–110 |
| Sardine can, 125–155 g | Fully automatic, multi-lane | 200–350 | 150–280 |
| Sardine can, 125–155 g | Semi-automatic, manual packing | 40–90 | 30–70 |
These are planning references, not guarantees. Actual CPM depends on can geometry, product format (loin chunks, shredded, whole fish), packing medium (oil, brine, sauce), and the filler's fill-weight control accuracy. A canned fish production line quote should always state both nameplate and expected effective CPM, with the assumptions behind the effective number.
Retort Batches: The Thermal Process Gate
The retort is where continuous flow becomes batch flow. A filler can produce 300 cans per minute, but a retort can only process one batch at a time, and each batch takes a fixed cycle time set by the scheduled thermal process. If the retort cannot absorb the filler's output, cans accumulate in baskets waiting for the retort, and the line either stops the filler or risks a cooling backlog.
Retort batch capacity is governed by four variables:
- Retort count. A single retort can never keep up with a continuous filler above very low CPM. Most fish canning lines run 2–6 retorts in parallel, with batches staggered so that one retort is loading while another is in come-up, another is in hold, and another is cooling.
- Basket capacity. Each retort holds a fixed number of baskets, and each basket holds a fixed number of cans depending on can geometry. Basket capacity × cans per basket × retort count = total cans per batch wave.
- Cycle time. A retort batch cycle has five segments: load, come-up (vent and heat penetration), hold (the scheduled process time), cooling, and unload. The hold time is set by the process authority based on product, container, formulation, and critical factors — the equipment supplier does not define it. Come-up and cooling are equipment-capability questions.
- Stagger logic. With N retorts and a cycle time of T minutes, the line can start a new batch every T/N minutes. If the filler produces faster than baskets fill in T/N minutes, the retort becomes the bottleneck.
The batch-gated rate — the average cans per minute the retort bank can process — is:
Batch-gated CPM = (retort count × cans per retort batch) ÷ cycle time in minutes
If batch-gated CPM is lower than filler effective CPM, the retort is the bottleneck, and no investment in a faster filler will raise shift output. This is the single most common sizing error on fish canning lines, and it is the error that a dedicated sterilization equipment for fish canning production line configuration is designed to prevent by matching retort count, basket capacity, and stagger logic to the filler CPM.
Engineering note: The scheduled process — hold time, temperature, and critical factors — is set by a process authority, not by the equipment supplier. Equipment suppliers specify the retort's capability (temperature distribution, come-up time, override pressure, cooling-water capacity) and must demonstrate that the equipment can deliver the scheduled process consistently. Reducing cycle time to raise capacity is not an equipment decision; it is a process-authority decision.
Shift Output: From Nameplate to Real Production
Shift output is the number buyers actually care about, and it is the number that nameplate CPM most reliably overstates. A shift is not eight hours of continuous filler running; it is a sequence of running periods interrupted by planned and unplanned events, each of which removes cans from the total.
Shift output is best modeled through OEE (overall equipment effectiveness), which separates the three loss categories that reduce theoretical output to real output:
- Availability — the fraction of shift time the line is scheduled to run and actually running. Lost to unplanned stops (equipment failure, product change, minor jam) and planned stops (cleaning, sanitizing, shift handover, break).
- Performance — the fraction of nameplate speed the line achieves when running. Lost to micro-stops, fill-weight corrections, and running below nameplate to stabilize quality.
- Quality — the fraction of produced cans that pass QA and become saleable. Lost to seaming defects, fill-weight rejects, and post-retort defects.
A disciplined fish canning plant runs at 60–80% OEE; a poorly disciplined one runs at 40–55%. The gap between 55% and 75% OEE on the same equipment is the difference between a line that pays back in three years and one that pays back in five. The shift output formula is:
Shift output = shift hours × 60 × filler nameplate CPM × OEE
For an 8-hour shift, a 300-CPM filler, and 70% OEE, shift output is 8 × 60 × 300 × 0.70 = 100,800 cans. The same filler at 55% OEE produces 79,200 cans — a 21% drop on the same equipment. This is why OEE, not nameplate CPM, is the number a capacity audit should measure first.
A Worked Reverse-Sizing Example
The most useful sizing exercise runs backwards: start from the buyer's target shift output, and derive the required filler CPM, retort configuration, and raw fish input. The table below works the example for a target of 80,000 saleable cans per 8-hour shift, using a mid-range tuna can format.
| Step | Input / assumption | Calculation | Result |
|---|---|---|---|
| 1. Target shift output | 80,000 saleable cans / 8 h shift | Buyer target | 80,000 cans |
| 2. Target hourly output | 80,000 ÷ 8 | Divide by shift hours | 10,000 cans/h |
| 3. Required effective CPM | 10,000 ÷ 60 | Divide by 60 | ~167 effective CPM |
| 4. Required nameplate CPM (at 75% performance factor) | 167 ÷ 0.75 | Divide by expected performance ratio | ~223 nameplate CPM |
| 5. Allow for availability and quality | Assume 90% availability × 98% quality | 0.90 × 0.98 = 0.882 | OEE performance factor 0.75 × 0.882 ≈ 66% OEE |
| 6. Retort batch-gated CPM needed | Must equal or exceed 167 effective CPM | Batch-gated CPM ≥ filler effective CPM | ≥ 167 CPM batch-gated |
| 7. Retort batch size | Assume 4,000 cans per retort batch | Equipment spec (reference) | 4,000 cans/batch |
| 8. Retort cycle time | Assume 90 min (come-up + hold + cool + load/unload) | Process authority + equipment | 90 min/batch |
| 9. Required retort count | (167 × 90) ÷ 4,000 | Filler CPM × cycle time ÷ batch size | ~3.8 → 4 retorts |
| 10. Raw fish input (from mass balance) | 80,000 cans × 130 g drained ÷ 50% yield | Cans × drained weight ÷ round-weight yield | ~20,800 kg round fish per shift |
From 80,000 cans per shift, the reverse sizing derives a filler of roughly 223 nameplate CPM, four retorts of 4,000-can capacity each on a 90-minute cycle, and about 20.8 tonnes of round fish per shift. Every assumption is a planning reference — the buyer's real can size, fish species, scheduled process, and OEE baseline will shift the numbers — but the structure of the calculation is what makes the sizing defensible.
Two reads from this table matter. First, the retort count (step 9) is derived, not chosen: if the buyer insists on three retorts instead of four, the retort becomes the bottleneck and shift output drops to whatever three retorts can process, regardless of filler speed. Second, the raw fish input (step 10) links this capacity model to the mass balance: sizing the line without sizing the raw fish supply produces a line that cannot be fed.
Where Sizing Goes Wrong: Common Bottlenecks
Most capacity shortfalls on fish canning lines trace to one of four bottlenecks. The checklist below maps the symptom to the layer and the corrective action.
| Symptom | Bottleneck layer | Diagnostic check | Corrective action |
|---|---|---|---|
| Filler running below 70% utilization; baskets waiting at retort | Retort batch capacity | Calculate batch-gated CPM; compare to filler effective CPM | Add retort, increase basket capacity, or shorten cycle time via process-authority review |
| Retort starved; filler stopped intermittently | Upstream supply (butchering, precooking, cleaning) | Measure feed rate at filler inlet; check precooker throughput | Add upstream capacity or buffer; balance line feed |
| Cooling backlog; cans accumulating post-retort | Cooling capacity | Measure cooling time and cooling-water temperature | Add cooling tunnel capacity or improve cooling-water flow |
| Low shift output despite high filler CPM and adequate retort | OEE (availability or performance) | Measure stop categories and duration; measure performance vs nameplate | Reduce planned stops (CIP optimization, changeover SMED); reduce micro-stops |
| High reject rate post-retort | Quality (seaming, fill weight) | Audit seamer setup and filler fill-weight accuracy | Recalibrate seamer; tighten filler feedback control |
The discipline is to measure each layer separately. A single "the line is slow" diagnosis hides whether the problem is the filler, the retort, the cooling, or the operating discipline — and each requires a different fix.
Equipment Choices That Determine Capacity
Each capacity layer maps to equipment decisions that set the ceiling for that layer. The mapping below is a framework for evaluating equipment against a capacity target, not a product recommendation.
- Filler-seamer. Inline volumetric fillers (lower CPM, lower capex) vs rotary weight-controlled fillers (higher CPM, higher capex, tighter giveaway). The choice sets nameplate CPM and the performance floor.
- Retort type. Batch still retorts (lower capex, flexible scheduling, slower cycle) vs continuous rotary retorts (higher capex, continuous flow, limited to specific can formats). The choice sets batch-gated CPM and the retort count needed.
- Retort count and basket capacity. Sized together to match filler effective CPM. Adding retorts raises batch-gated CPM linearly; increasing basket capacity raises it step-wise.
- Buffer between filler and retort. A can accumulator between seamer and retort buffers the batch-gated retort from the continuous filler, smoothing the mismatch and reducing filler stop-start. Buffer size is a function of retort cycle time and filler CPM.
- Cooling tunnel. Sized to match retort throughput. An undersized cooling tunnel creates a post-retort bottleneck that is often mistaken for a retort problem.
Capacity Calculator and Measurement Plan
The capacity calculator referenced in this article provides a structured spreadsheet with input fields for target shift output, shift hours, target OEE, filler nameplate CPM, retort batch size, retort cycle time, and raw fish yield. Output fields derive required effective CPM, required retort count, expected shift output at the stated OEE, and required raw fish input per shift. It is designed for greenfield sizing and for auditing an existing line against its nameplate.
To request the calculator: Share your target shift output (cans per shift or per day), can size and format, fish species, shift structure (hours, shifts per day, planned CIP time), and whether the line is greenfield or an existing audit. HSYL will return a pre-filled calculator with reference ranges for your format and a blank input column for your site data.
For an existing line, the measurement plan is to record filler effective CPM, retort batch-gated CPM, and shift OEE separately for at least two weeks. The gap between the three numbers is the gap between nameplate and reality, and it tells you which layer to invest in first.
Scope, Sources and Limitations
Scope. This article covers time-flow and unit-flow capacity from the filler to the cooled, palletized can. It does not cover mass balance (covered in the companion article on raw fish, trim loss, cook loss and saleable output), scheduled thermal-process design, histamine control, double-seam qualification, or regulatory compliance — each is a separate engineering topic.
Limitations. All CPM, batch-size, cycle-time, and OEE ranges are planning references drawn from publicly available industry material for tuna and sardine canning. Actual values depend on can size, fish species, product format, automation level, scheduled process, and operating discipline. HSYL does not publish project-specific capacity figures without verified project evidence. A defensible capacity number for your plant requires measurement at your line, not adoption of these reference ranges as targets.
Source basis. The three-layer capacity model and OEE definitions are consistent with publicly available industry and standards material on overall equipment effectiveness and canning line design. Retort cycle-time components are consistent with FDA and Codex low-acid canned food process guidance. Specific source versions and review dates are recorded in the internal Evidence Brief and are available on request. Equipment-capability statements refer to HSYL equipment specifications and do not imply a scheduled-process or compliance conclusion.
Reviewer and date. Process Engineering & QA, HSYL. Last technical review: 2026-07-12. This article should be re-reviewed when the referenced standards material is updated, or when HSYL publishes verified project capacity data that would replace the reference ranges with project-specific figures.
Capacity Sizing Resources and Equipment References
Three resources complement this capacity model when sizing or auditing a fish canning line. The first is the canning line hub, which frames the full equipment scope; the second is the canned fish commercial page, which anchors the species-specific line; the third is the sterilization equipment page, which carries the retort detail that governs the batch-gated layer.
- Canning production line hub — full turnkey scope, capacity ranges by can format, and the equipment map that this capacity model sizes against.
- Canned fish production line — the species-level line page with filler, seamer, and retort configuration references.
- Sterilization equipment for fish canning production line — retort equipment detail that governs the batch-gated capacity layer.
Frequently Asked Questions
How is fish canning line capacity usually stated?
What is the difference between nameplate CPM and effective CPM?
How many retorts does a fish canning line need?
Can a faster filler increase my shift output?
Does HSYL guarantee a specific shift output on a new line?
What data do I need to send HSYL for a capacity sizing review?
Must-Read Blogs For Chain Restaurants Owner

 Fish Meal Production Line
 Bean Product Production Line
 Frozen French Fries Production Line
 Chicken Feet Peeling Production Line
Ready to Get Started?