
Water and Energy Balance per Tonne of Canned Fish: How to Build a Defensible Baseline
"How much water and energy does a fish cannery use per tonne of canned fish?" is a question that sounds simple and is not. The answer depends on the boundary you draw, whether you measure peak or average consumption, and whether you normalize by canned-fish output or by raw-fish input. A baseline that does not define these three things is not defensible — it is a number that cannot be compared, audited, or improved. This article shows how to build a defensible water and energy balance: define the boundary, meter the flows, normalize per tonne of saleable output, and separate peak from average demand.
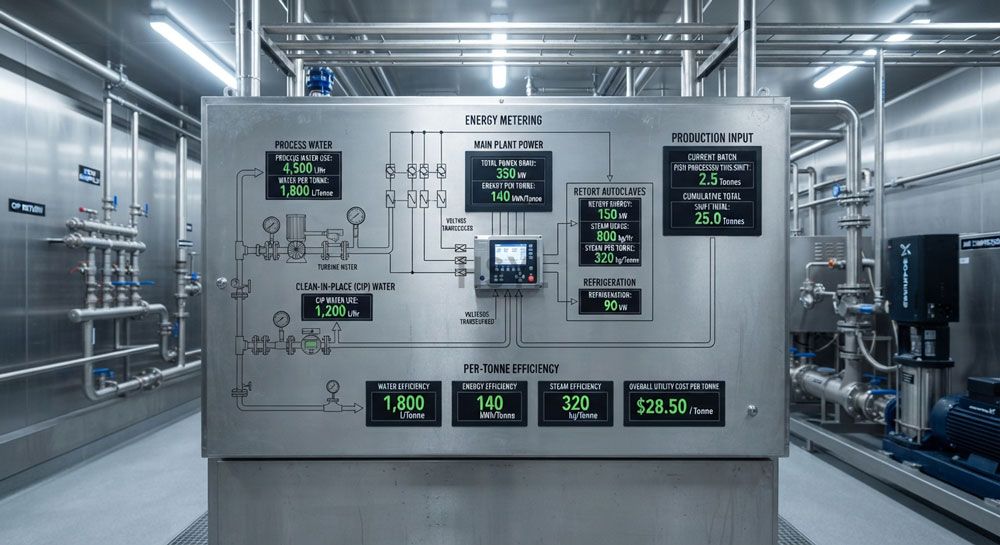
The scope covers water and energy balance methodology for a fish cannery, from utility inlet to effluent and product output. It covers boundary definition, metering, per-tonne normalization, and peak vs average. It does not cover retort utility optimization (covered separately), mass balance, or capacity. The turnkey canning line scope page carries the full line scope.
Boundary Definition
The boundary is the line around the cannery that defines what is measured. A boundary that includes raw-fish receiving, processing, retort, and packaging measures everything; a boundary that excludes receiving and packaging measures only the processing core. Neither is wrong, but the boundary must be stated, because per-tonne consumption changes with boundary scope.
| Boundary scope | What is included | Typical use |
|---|---|---|
| Full factory | Receiving, processing, retort, packaging, utilities, admin, cold storage | Factory-level sustainability reporting |
| Processing core | Processing, retort, packaging (excludes admin and cold storage) | Operational efficiency comparison |
| Line-level | One production line (e.g., tuna line) from receiving to pallet | Line-by-line benchmarking |
| Equipment-level | One major equipment (e.g., retort bank) | Equipment efficiency and upgrade justification |
Metering the Flows
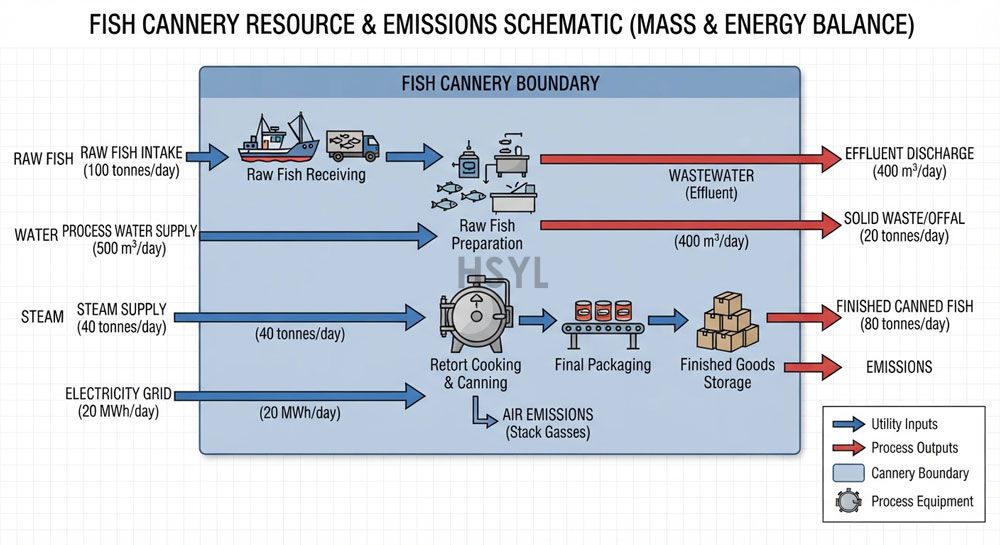
Defensible per-tonne numbers require metering, not estimation. Water in, steam in, electricity in, effluent out, and product out must each be metered at the boundary. The metering plan should cover:
- Water metering. Main water inlet to the boundary; sub-meters on major consumers (thawing, washing, CIP, retort cooling, boiler make-up).
- Energy metering. Main electricity inlet; steam metering from boiler; fuel metering if boiler is on-site; sub-meters on major equipment (retort, precooker, cold storage).
- Product metering. Canned-fish output at the boundary (pallets or cases per shift); raw-fish input for cross-check against mass balance.
- Effluent metering. Effluent volume out; effluent load (BOD, COD, solids) for environmental reporting.
Per-Tonne Normalization
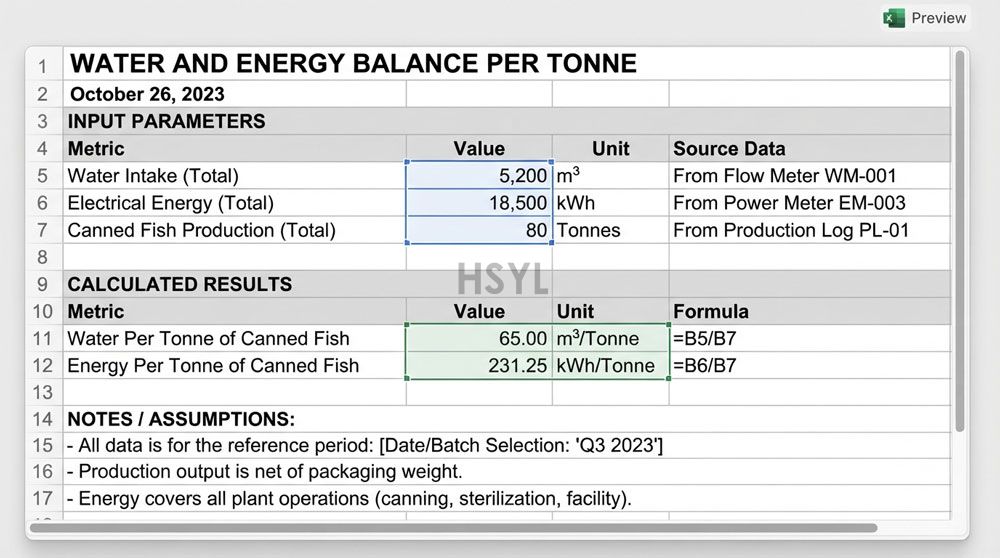
Per-tonne normalization divides utility consumption by canned-fish output. The question is which output — net weight (total can contents), drained weight (solid fish), or round-fish equivalent. Each gives a different per-tonne number, and each is valid for a different purpose.
Engineering note: State the normalization basis with the per-tonne number. A per-tonne figure without a stated basis (net, drained, or round) cannot be compared to another cannery's per-tonne figure. The EU BAT reference document and industry sustainability frameworks require the basis to be stated.
A canned fish production line baseline should report per-tonne on at least two bases — net weight (for commercial comparison) and drained weight (for process comparison) — and should track the basis consistently across reporting periods.
Peak vs Average Demand
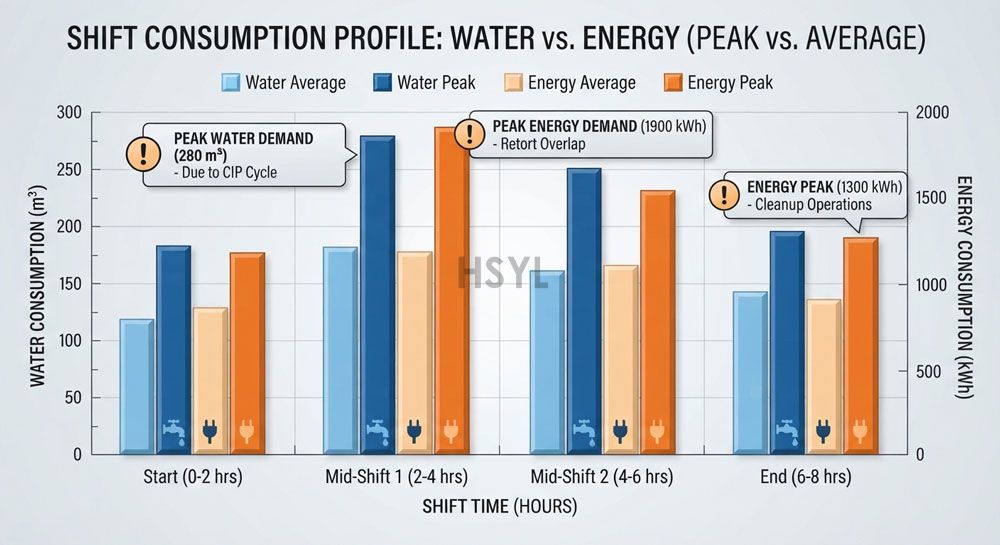
Average consumption is the total divided by time; peak consumption is the maximum instantaneous demand. Both matter, and they serve different purposes. Average drives total utility cost and per-tonne efficiency; peak drives utility supply capacity and demand charges. A baseline that reports only average hides the peak, which is what determines whether the utility supply is sized correctly.
Peak demand in a fish cannery is typically driven by retort come-up (steam demand spike), CIP (water and hot water demand), and thawing (water demand). A retort sterilization equipment for fish canning with multiple retorts on staggered cycles smooths the peak; retorts on synchronized cycles create a larger peak. The peak-vs-average diagnostic identifies whether utility supply constraints are caused by total consumption or by peak demand.
Scope, Sources and Limitations
Scope. This article covers water and energy balance methodology for a fish cannery, from utility inlet to effluent and product output. It covers boundary definition, metering, per-tonne normalization, and peak vs average. It does not cover retort utility optimization, mass balance, or capacity.
Limitations. All balance methodology and reference structures are drawn from publicly available industry and environmental material (EU BAT, ISO 14001 frameworks). Actual per-tonne figures depend on product, can size, automation level, and utility supply. HSYL does not publish project-specific per-tonne numbers without verified evidence.
Source basis. Balance methodology is consistent with EU BAT 2019/2031, ISO 14001 environmental management frameworks, and industry sustainability reporting guidance. Equipment-capability statements refer to HSYL equipment specifications.
Water and Energy Balance Resources
Three resources complement this balance content. The canning line hub carries the full line scope. The canned fish line anchors the species-level line. The retort equipment page carries the utility-intensive retort detail.
- Turnkey canning line scope — the full line scope that the balance boundary is drawn around.
- Canned fish production line — the species-level line whose per-tonne output normalizes the balance.
- Retort sterilization equipment for fish canning — the utility-intensive retort whose peak demand drives supply sizing.
Next Step: Build Your Defensible Baseline
Send HSYL your boundary scope, product format, current metering plan, and reporting basis (net, drained, or round). HSYL will return a pre-filled balance worksheet with the boundary, metering, and per-tonne normalization framework for your scope and a metering plan review that confirms your sub-meter coverage.
Frequently Asked Questions
How is water and energy consumption per tonne of canned fish calculated?
What boundary should I use for a fish cannery balance?
What is the difference between peak and average utility demand?
How do I meter a fish cannery for a balance?
Can HSYL provide a per-tonne water and energy figure for my cannery?
Must-Read Blogs For Chain Restaurants Owner

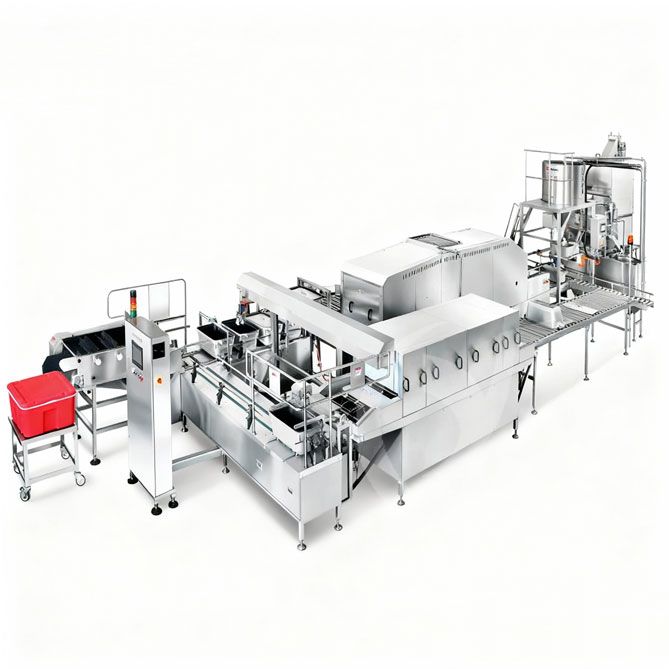
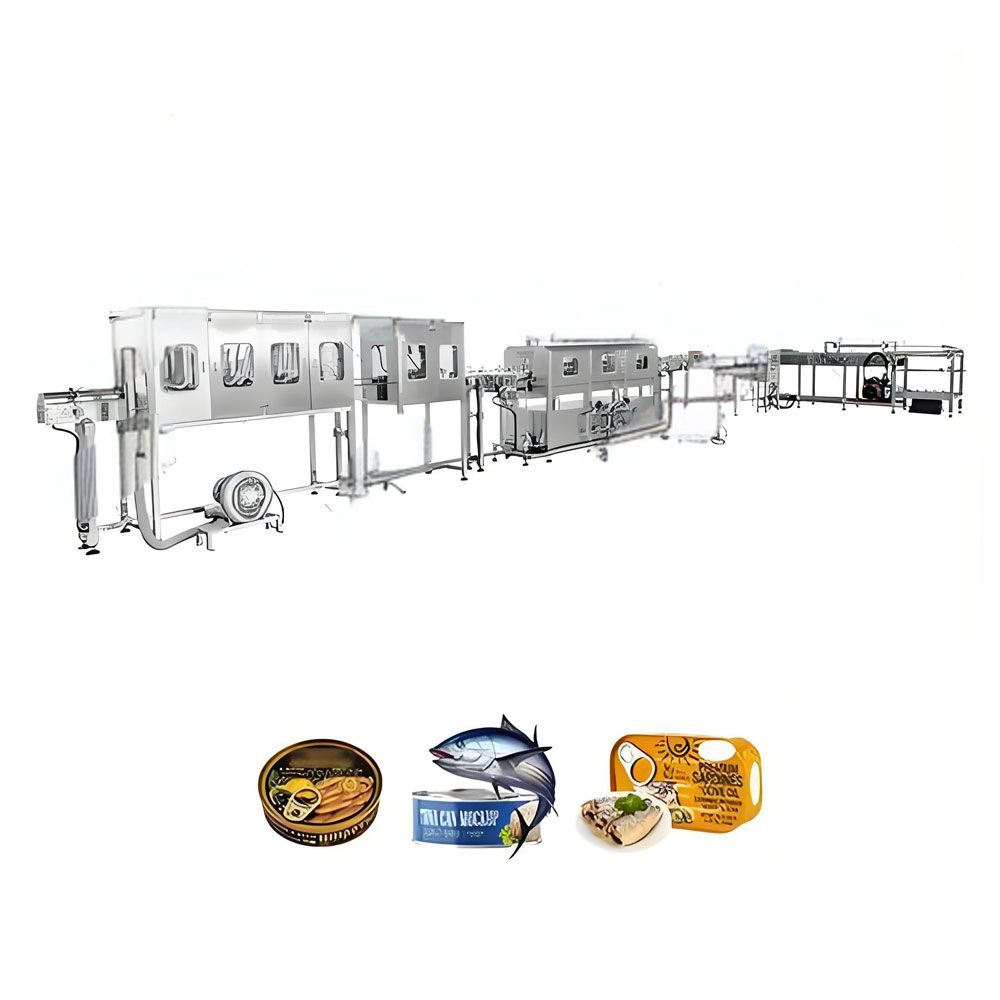 Canned Fish Production Line
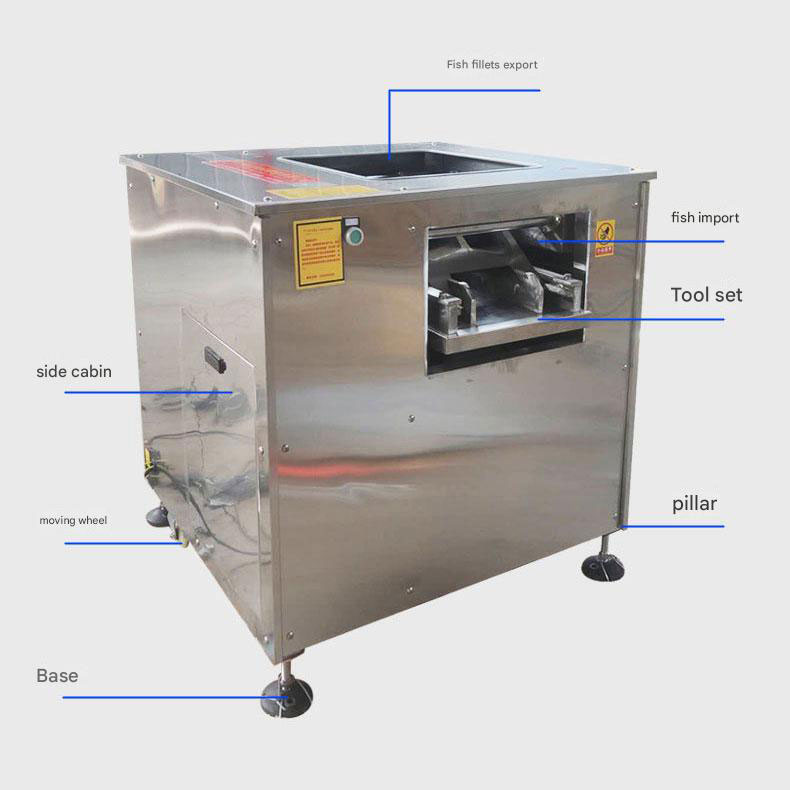 Fish Slicer Machine
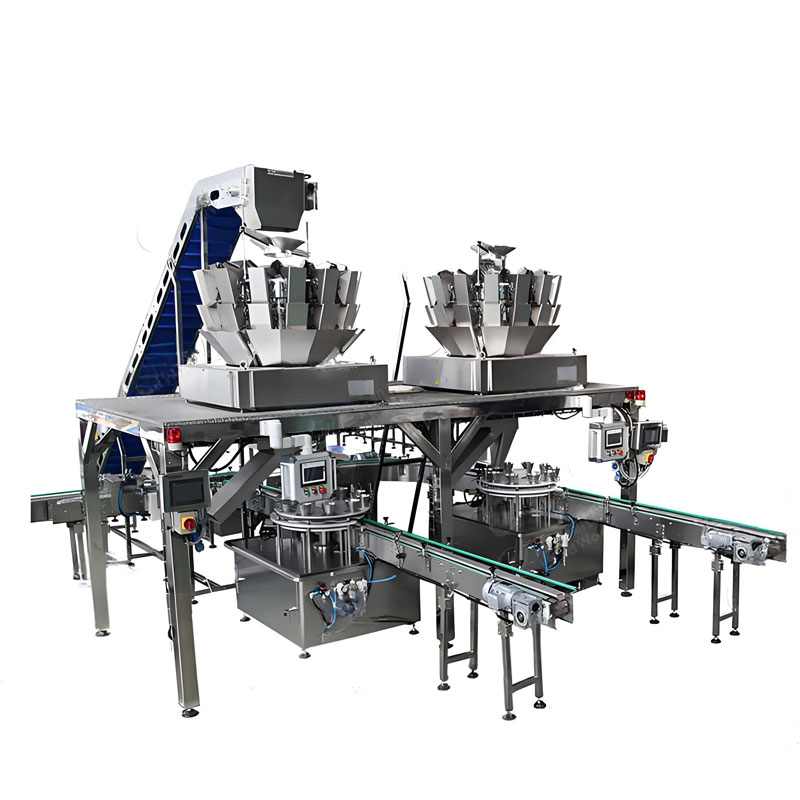 Automatic Chicken Canned Food Production Line
Ready to Get Started?