
Fish Canning Line Mass Balance: Raw Fish, Trim Loss, Cook Loss and Saleable Output
When a fish canning project moves from concept to budget approval, the single number that decides whether the plant pays back is not the equipment price — it is the saleable output per tonne of raw fish. Yet most early-stage estimates collapse the entire loss into one fuzzy "yield" figure, which makes it impossible to defend the number to an investor or to diagnose it later when the line underperforms. This article breaks the fish canning line mass balance into discrete loss nodes, shows a worked example from 1,000 kg of round tuna, and provides a downloadable balance sheet template so you can plug in your own fish species, size profile and equipment set.
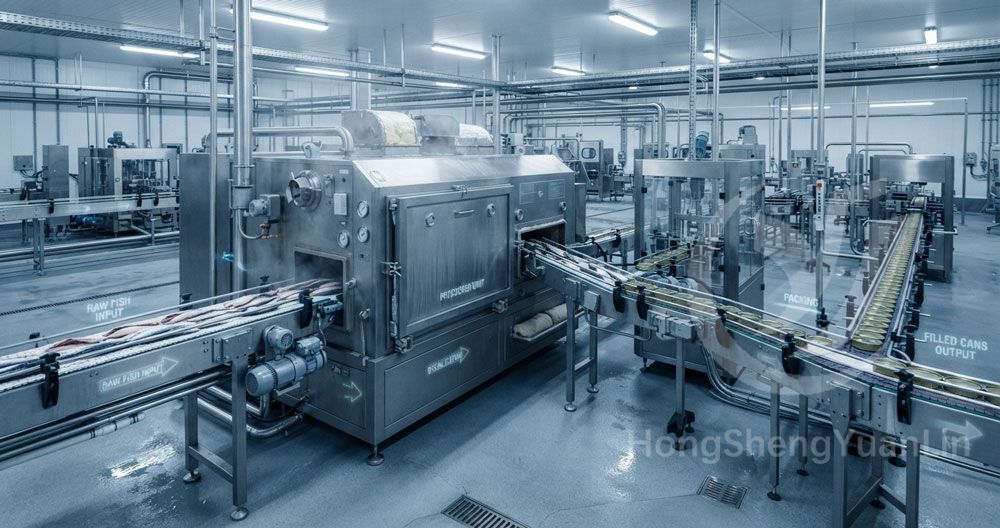
The scope is deliberately narrow: weight flow from raw fish receiving at the factory gate to sealed, retorted, saleable canned fish. It does not cover energy balance, water balance, or scheduled-process design, each of which deserves its own treatment. For a complete canning production line workflow, this mass balance is one of three planning layers — the others are capacity sizing and thermal-process validation.
What a Fish Canning Line Mass Balance Actually Measures
A mass balance on a fish canning line tracks weight as it enters, transforms, and leaves each process node. The arithmetic is simple — input equals output plus accumulation plus loss — but three boundary decisions determine whether the number is useful or misleading.
Boundary 1: Round weight vs dressed weight. Round weight is the whole fish as received, including head, tail, viscera and bones. Dressed weight is what remains after butchering. A mass balance that starts at round weight captures the full loss picture; one that starts at dressed weight hides the largest single loss node and makes two plants look identical when they are not.
Boundary 2: Net weight vs drained weight. A can of fish in oil or brine contains both solid fish and packing medium. Net weight is the total contents; drained weight is the solid fish after the liquid is removed. Saleable output for mass-balance purposes should be tracked at both points, because the packing medium contributes to net weight but not to fish yield. Confusing the two is the most common error in early-stage yield estimates.
Boundary 3: Apparent loss vs true solids loss. Most of the weight lost between receiving and the finished can is water, not fish solids. Precooking can remove 8–12% of the pre-cook weight, almost entirely as water and drip. This is an apparent loss from a weight-flow perspective but a necessary process outcome, not a defect. True solids loss — fish muscle that should have been in the can but ended up as waste — is far smaller and is the number that improvement projects should target.
Practical note: Defend your saleable-output number by reporting two figures: saleable drained weight as a percentage of round weight (the investor-facing number), and recoverable solids loss as a percentage of available flesh (the engineering number). Reporting only the first hides where to improve; reporting only the second confuses non-technical stakeholders.
The Loss Nodes in a Fish Canning Line
A fish canning line has six to eight meaningful loss nodes between receiving and the finished pallet. The table below lists the nodes, the typical reference loss range, and the primary variable that drives the loss. The ranges are drawn from publicly available industry and FAO source material for tuna and sardine canning; they are planning references, not guarantees, and actual values depend on fish species, size profile, season, fat content, equipment set and operating discipline.
| Node | What is lost | Reference loss range (of incoming weight) | Primary driver |
|---|---|---|---|
| Receiving & holding | Ice, blood, drip | 0.5–2% | Time-temperature history before butchering |
| Thawing (if frozen) | Drip loss | 2–6% | Thawing method, temperature, time |
| Butchering (head, tail, viscera) | Head, viscera, tail, skin-on frame | 30–40% (tuna), 25–35% (sardine) | Fish size, species, anatomy, knife set-up |
| Precooking | Water, drip, exuded fat | 8–12% of pre-cook weight | Core temperature, steam uniformity, cooling method |
| Cleaning / loin trimming | Blood meat, skin, bone, dark flesh | 5–10% of cooked weight | Trimming spec, operator skill, inspection |
| Portioning & filling | Giveaway, trimmings reworked or discarded | 1–3% | Fill-weight control, portioner accuracy |
| Seaming | Minimal (product loss only on defects) | <0.5% | Double-seam quality, reject rate |
| Retort & cooling | Further drip into packing medium | 1–3% of can net weight | Process schedule, agitation, cooling rate |
Two things are immediately visible. First, butchering is by far the largest weight-removal step, but most of that removal is anatomical — heads and viscera are not saleable fish muscle in any canning format. Second, precooking and cleaning are where the most recoverable yield hides, because the line is removing water and trimmings that are partly controllable.
Raw Fish to Dressed Fish: Receiving, Thawing and Butchering Loss
The first mass-balance segment covers everything from the truck at the gate to the cleaned, headed and gutted fish ready for precooking. For frozen tuna — the dominant raw material for tropical canneries — this segment includes thawing, which is often underestimated.
Receiving loss is mostly drip and blood released while the fish waits. It looks small on a percentage basis (0.5–2%), but on a 20-tonne-per-day line it is 100–400 kg of apparent loss per day, and more importantly it is a food-safety signal: high receiving drip often indicates temperature abuse or delayed handling, which for histamine-forming species such as tuna is a compliance issue, not just a yield issue.
Thawing loss depends sharply on method. Air thawing is slow and loses more drip; water immersion or spray thawing is faster but can leach soluble protein; resistive or microwave thawing is the most controllable but the highest in capital cost. A 2% difference in thawing drip on a frozen-tuna line is equivalent to roughly 1% of saleable output — a number that easily justifies a better thawing system on a multi-year horizon.
Butchering loss is anatomical and largely fixed by species and fish size, but the residual flesh left on the frame is controllable. A modern canned fish production line pairs butchering with a recovery step — typically a meat-bone separator on the frame — that pulls back 2–5% of round weight as mince suitable for lower-grade products or pet food. Whether that mince is sold, reworked, or discarded changes the headline yield number without changing the physical process.
Precooking and Cleaning: The Largest Hidden Yield Drop
Precooking is the step where the most controllable yield disappears, and it is the step most often treated as a black box. The objective of precooking is to set the muscle so that the loins can be cleaned and packed, not to cook the fish to its final state. The loss mechanism is water evaporation and drip, plus some fat exudation in fatty species.
Three variables drive precooking loss, and all three are equipment-and-process linked:
- Core temperature target. Higher core temperatures set the muscle more firmly and make cleaning easier, but they also drive more water out. The right target is the lowest temperature that still allows clean loin separation — a decision that belongs to the process engineer, not the equipment supplier.
- Steam uniformity. A continuous precooker with poor steam distribution creates hot spots that overcook some loins and undercook others. The overcooked loins lose extra water; the undercooked loins create extra cleaning loss downstream. Steam-distribution design, bleeder management and condensate drainage are equipment capability questions that directly shift the balance.
- Cooling method. Hot fish pulled from the precooker continues to lose water until it cools. Spray cooling, air cooling and brine-immersion cooling each produce different drip profiles and different downstream cleaning yields.
For tuna, the precooking step is so central to yield that a dedicated canned tuna processing production line typically integrates precooker design, cooling conveyor and loin-cleaning station as a single tuned system rather than three separate purchases. The mass-balance difference between a well-integrated and a poorly integrated precooking section can be 2–4% of round weight — often the single largest improvement available on an existing line.
Cleaning and loin trimming follows precooking and removes blood meat, skin remnants, bone and dark flesh. This is the node where the line converts apparent loss (water) into true solids loss (fish muscle that could have been in the can). Trimming spec is the dominant variable: a tighter spec produces a more uniform, lighter-colored product but discards more usable muscle; a looser spec recovers more weight but may fail buyer or regulatory color and quality expectations. The decision is commercial, not purely technical, and should be made explicitly rather than by default.
Filling, Seaming and Retort: Final Yield and Net Content Control
The last segment of the mass balance covers the filled, sealed and thermally processed can. Weight loss here is small as a percentage but high in commercial impact, because it interacts with net-content regulations and drained-weight compliance.
Filling giveaway is the gap between the declared net or drained weight on the label and the actual weight in the can. Modern fillers and portioners can hold giveaway to 1–2% above declared weight; older or poorly maintained equipment can run at 4–6%. Because giveaway is fish you give away at the price of the can, reducing it is the highest-ROI yield improvement on many lines, and it does not require changing the process — only the filling and checkweighing equipment and its control logic.
Seaming loss is minimal in mass terms but critical in quality terms. A double-seam defect does not lose much fish, but it loses the entire can to reject or rework, and it is a food-safety risk if the seam failure is not caught. Seaming belongs in the mass balance only as a reject-rate line item, not as a weight-loss node.
Retort and cooling remove a further 1–3% of can net weight as drip into the packing medium. For mass-balance purposes this is not a true loss — the drip stays inside the can and contributes to net weight — but it changes the drained-weight ratio and therefore the apparent yield if you track only drained weight. This is why a mass balance that ignores the retort step can appear to show a sudden "loss" that is really just water redistribution inside the can.
Engineering note: The scheduled thermal process is set by a process authority based on product, container, formulation and critical factors. Equipment suppliers specify the retort's capability — temperature distribution, come-up time, override pressure, cooling-water capacity — but do not define the scheduled process. Yield optimization at the retort must never compromise the validated process.
A Worked Mass Balance Example: 1,000 kg of Round Tuna
To make the balance concrete, the table below traces 1,000 kg of round frozen tuna through a hypothetical canning line to saleable drained weight. Every percentage is a planning reference drawn from the ranges above, not a guaranteed result. The purpose is to show the arithmetic and the relative size of each node, not to predict a specific plant's performance.
| Node | Input (kg) | Loss % | Loss (kg) | Output (kg) |
|---|---|---|---|---|
| Receiving & thawing | 1,000 | 4% | 40 | 960 |
| Butchering (head, viscera, frame) | 960 | 35% | 336 | 624 |
| Precooking | 624 | 10% | 62 | 562 |
| Cleaning & loin trimming | 562 | 7% | 39 | 523 |
| Portioning & filling (to cans) | 523 | 2% | 10 | 513 (filled fish weight) |
| Retort drip (stays in can, not a true loss) | 513 | 2% | 10 | 503 (drained fish weight) |
From 1,000 kg of round tuna, the line in this example produces roughly 503 kg of drained fish weight in the finished cans — about 50% of round weight. The remaining 497 kg splits into anatomical removal (heads, viscera, frames — about 336 kg), water and drip lost to precooking and cooling (about 102 kg), and recoverable trimmings and giveaway (about 49 kg, part of which may be recovered as mince).
Two reads from this table matter for planning. First, the headline yield (50%) is dominated by anatomy, not by controllable loss — so a yield-improvement project focused only on butchering will fail unless it includes a frame-recovery step. Second, the controllable loss (precooking + cleaning + filling giveaway, about 111 kg or 11% of round weight) is where engineering and operating discipline actually move the number. A 10% reduction in that controllable loss — from 111 kg to 100 kg — lifts saleable output from 503 kg to 514 kg, a 2.2% revenue gain on the same raw fish cost.
How the Balance Shifts by Species: Tuna vs Sardine
The same mass-balance structure produces very different numbers for different fish. The table below compares tuna and sardine canning at a planning-reference level.
| Node | Tuna (reference) | Sardine (reference) | Why it differs |
|---|---|---|---|
| Butchering loss | 30–40% | 25–35% | Sardine is smaller; head and viscera are a smaller fraction of body weight |
| Precooking | 8–12% | Often skipped or replaced by blanching | Sardine is typically packed raw or blanched, not pre-cooked |
| Cleaning / trimming | 5–10% | Lower, integrated with packing | Tuna loin cleaning is a separate manual or automated step; sardine is packed whole or as a butterfly |
| Filling format | Loin chunks or shredded | Whole or butterfly in oil/sauce | Drained-weight ratio differs because of bone-in packing |
| Saleable drained weight / round weight | ~45–52% | ~55–62% | Sardine retains more anatomical mass in the can |
A sardine line — such as the sardine canned food production line — therefore reports a higher headline yield than a tuna line, but the controllable loss pool is smaller and the improvement levers are different (blanching control, packing-medium dosing, and bone-in fill-weight control rather than precooking and loin cleaning). A mass-balance template that forces both species into the same node structure will mislead unless it allows nodes to be marked "not applicable" for a given species.
Equipment Choices That Shift the Balance
Each loss node maps to equipment decisions that can widen or narrow the loss. The mapping below is not a product recommendation — it is a framework for evaluating equipment against your yield target.
- Thawing. Air thawing (lowest capex, highest drip) vs water spray (medium) vs resistive or microwave (highest capex, lowest drip). The yield difference is 2–4% of round weight for frozen lines.
- Precooker. Batch still retorts used as precookers (poor steam uniformity) vs continuous atmospheric precookers (better uniformity, better yield) vs steam-tunnel designs with zoned temperature control. The yield difference is typically 1–3% of pre-cook weight.
- Cleaning station. Manual loin cleaning (highest labor, most flexible spec) vs automated loin cleaners (consistent spec, lower labor, less recovery flexibility). The choice changes the split between saleable loin and recoverable mince, not the total yield.
- Portioner and filler. Volumetric fillers (lower accuracy, higher giveaway) vs weight-controlled fillers with checkweigher feedback (higher accuracy, lower giveaway). The yield difference is 1–3% of filled weight, recovered at full can price.
- Frame recovery. Meat-bone separator on the butchered frame recovers 2–5% of round weight as mince. Whether this is sold, reworked, or discarded is the single largest swing factor in the headline yield number.
How to Diagnose an Out-of-Balance Line
A mass balance is only useful if it is measured, not just calculated. The checklist below maps each node to the measurement needed to defend the number and to spot drift before it becomes a budget problem.
| Node | Measurement | Frequency | Drift signal |
|---|---|---|---|
| Receiving | Inbound weight per lot, fish temperature | Every lot | Rising receiving drip or temperature indicates cold-chain failure |
| Thawing | Weight in vs weight out per batch | Every batch | Drip loss above reference range signals thawing-time or temperature drift |
| Butchering | Dressed weight per batch; frame weight | Per shift | Rising frame weight or falling dressed yield signals knife wear or operator drift |
| Precooking | Weight in vs weight out; core temperature sample | Per batch or per shift | Cook loss above reference signals steam-supply or temperature-setpoint drift |
| Cleaning | Cleaned loin weight; trimmings weight | Per shift | Rising trimmings weight signals spec drift or undercooked loins |
| Filling | Checkweigher giveaway statistics | Continuous | Givingaway above target signals filler drift or portioner wear |
| Retort | Drained-weight sample post-retort | Per retort batch | Drained-weight drift signals formulation or process change needing review |
The discipline is to record every node every shift, even when nothing is wrong. A mass balance measured only when yields drop is a mass balance that cannot diagnose why, because there is no baseline to compare against.
Downloadable Mass Balance Sheet Template
The balance sheet template referenced in this article provides a structured spreadsheet with one row per loss node, columns for input weight, output weight, loss percentage, loss driver, measurement frequency and a notes field for species-specific assumptions. It is designed to be filled in per shift or per campaign and to produce both the investor-facing headline (saleable drained weight / round weight) and the engineering-facing breakdown (controllable loss by node).
To request the template: Share your fish species, product format (loin, chunk, whole, butterfly), can size, target daily output and whether the line is greenfield or an existing audit. HSYL will return a pre-filled template with the reference ranges for your species and a blank measurement column for your site data.
Scope, Sources and Limitations
Scope. This article covers weight-flow mass balance from raw fish receiving to saleable canned fish. It does not cover energy balance, water balance, scheduled thermal process design, histamine control, double-seam qualification, or regulatory compliance — each is a separate engineering topic with its own evidence requirements.
Limitations. All loss percentages are planning references drawn from publicly available industry material for tuna and sardine canning. Actual values depend on fish species, size profile, season, fat content, equipment set, operating discipline and product specification. HSYL does not publish project-specific yield figures without verified project evidence. A defensible mass balance for your plant requires measurement at your nodes, not adoption of these reference ranges as targets.
Source basis. Loss-node structure and reference ranges are consistent with publicly available FAO fisheries technical material, Codex codes of practice for canned fish, and industry canning reference texts. Specific source versions and review dates are recorded in the internal Evidence Brief and are available on request. Equipment-capability statements refer to HSYL equipment specifications and do not imply a scheduled-process or compliance conclusion.
Reviewer and date. Process Engineering & QA, HSYL. Last technical review: 2026-07-11. This article should be re-reviewed when the referenced Codex or FAO material is updated, or when HSYL publishes verified project yield data that would replace the reference ranges with project-specific figures.
Planning Resources for Fish Canning Line Sizing
Three resources complement this mass balance when sizing or auditing a fish canning line. The first is the canning line hub, which frames the full equipment scope; the second is the canned fish commercial page, which anchors the species-specific line; the third and fourth are the tuna and sardine line pages, which carry the equipment detail for the two species used as examples in this balance.
- Canning production line hub — full turnkey scope, capacity ranges, and the canning equipment map that this mass balance plugs into.
- Canned fish production line — the species-level line page covering tuna, sardine, mackerel and related formats.
- Fully automatic canned tuna processing production line — tuna-specific equipment set, including the precooking and loin-cleaning sections that drive the largest controllable loss node.
- Sardine canned food production line — sardine-specific process, where the mass-balance structure differs because precooking is replaced by blanching or direct packing.
Frequently Asked Questions
What is a good saleable yield for a fish canning line?
How do I measure precooking loss on my line?
Can HSYL guarantee a specific yield on a new line?
What data do I need to send HSYL to get a mass-balance review?
Does the mass balance change if I use frozen vs fresh fish?
Must-Read Blogs For Chain Restaurants Owner

 Fish Meal Production Line
 Salmon Processing Line
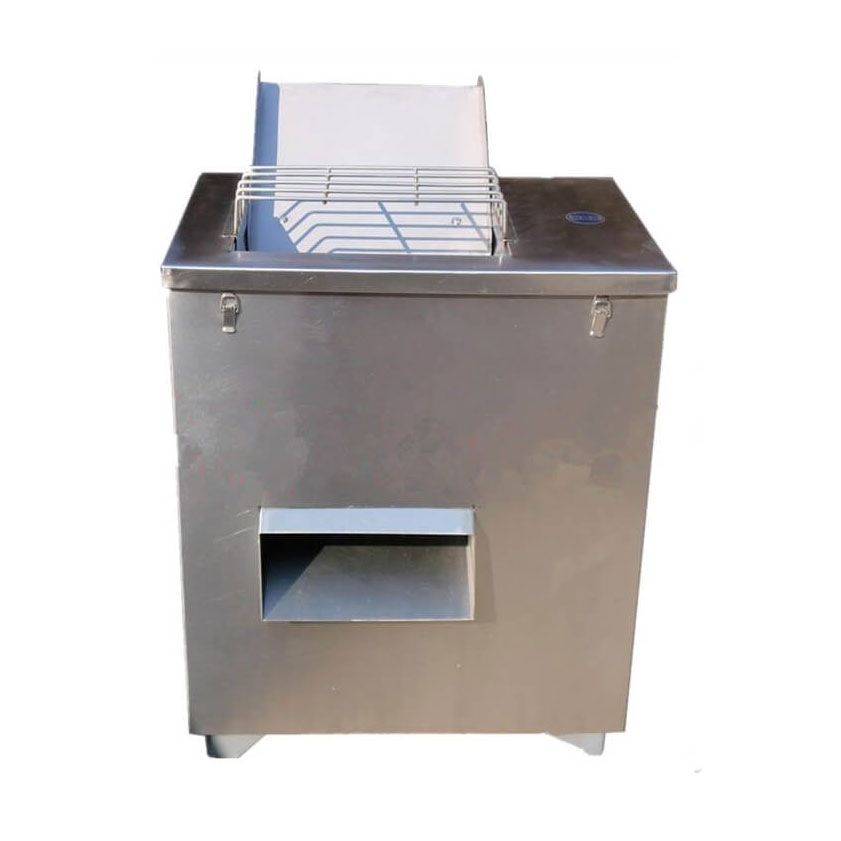 Fish Cutting Machine
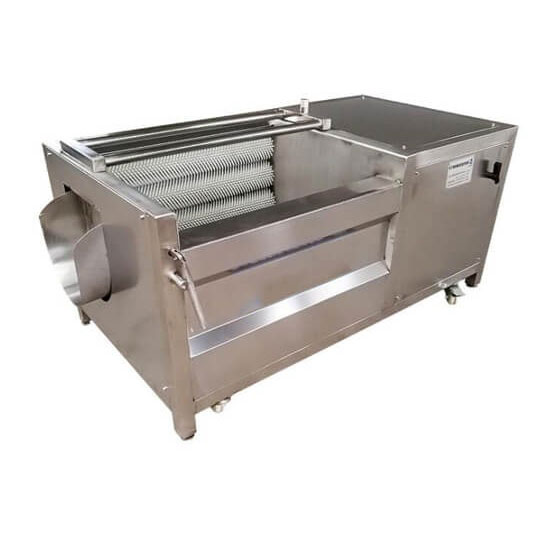 Fish Scaler Machine
Ready to Get Started?